
FinOps is broken. Not because AWS doesn't give you the data — Cost Explorer, Compute Optimizer, Trusted Advisor, Cost Optimization Hub — the data is there. The problem is that nobody actually opens it.
We've audited enough engineering teams to know the pattern. The FinOps review happens once a month, usually after the bill arrives, usually driven by a VP asking uncomfortable questions. By then, whatever caused the spike is three weeks cold. Engineers don't go into Cost Explorer proactively because the interface is built for finance teams, not for the person who deployed the service.
The gap between having the information and acting on it — that's the real FinOps problem. So we built something to close it.
What We Launched: A Chat Interface for Your AWS Account
The FinOps Intelligence Platform is a Claude-powered agent with read-only access to your AWS account. You open a browser, type a question in plain English, and get an answer with real numbers from your real account — in about ten seconds.
Questions like:
- "What's my biggest cost this week and why?"
- "How much am I paying for NAT Gateway across all regions?"
- "Which EC2 instances are oversized and what would I save by right-sizing them?"
- "What anomalies showed up in the last 30 days?"
- "Which team is spending the most, broken down by environment tag?"
The agent connects to Cost Explorer, Compute Optimizer, Cost Optimization Hub, and the EC2/RDS APIs. It correlates data across services and responds with concrete numbers and actionable recommendations — not high-level summaries, not percentage ranges, actual dollar amounts tied to specific resources.
The code is open source: github.com/devops-arg/finops-agent — MIT license, Python backend, vanilla JS frontend, docker-compose to run it.
A Quick Product Tour
Six screens do the whole job. All screenshots below use the mock fintech "Ribbon" profile that ships with the demo — no real AWS data, safe to show in any context.
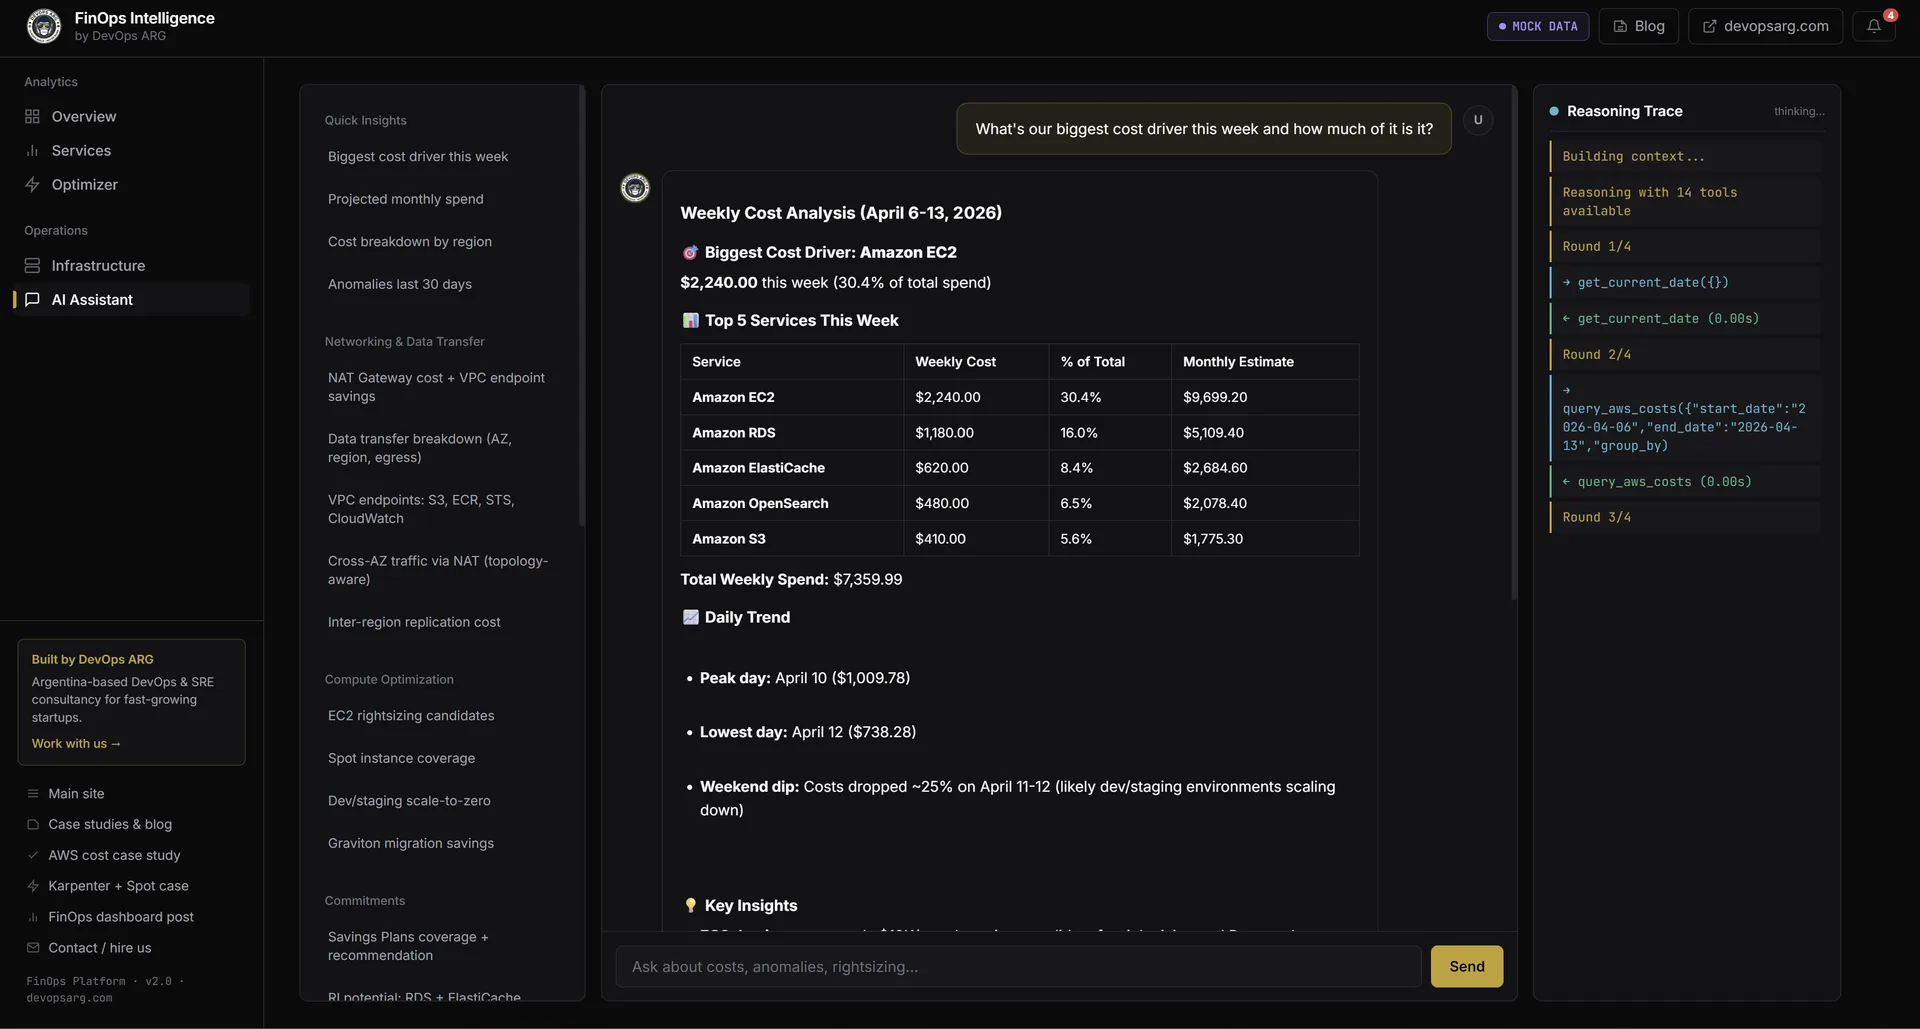
1. Ask in plain English
Type a question, get a structured answer with real numbers in ~10 seconds. The right-hand panel streams the reasoning trace live — you see every tool call the agent makes before it synthesizes the final answer.
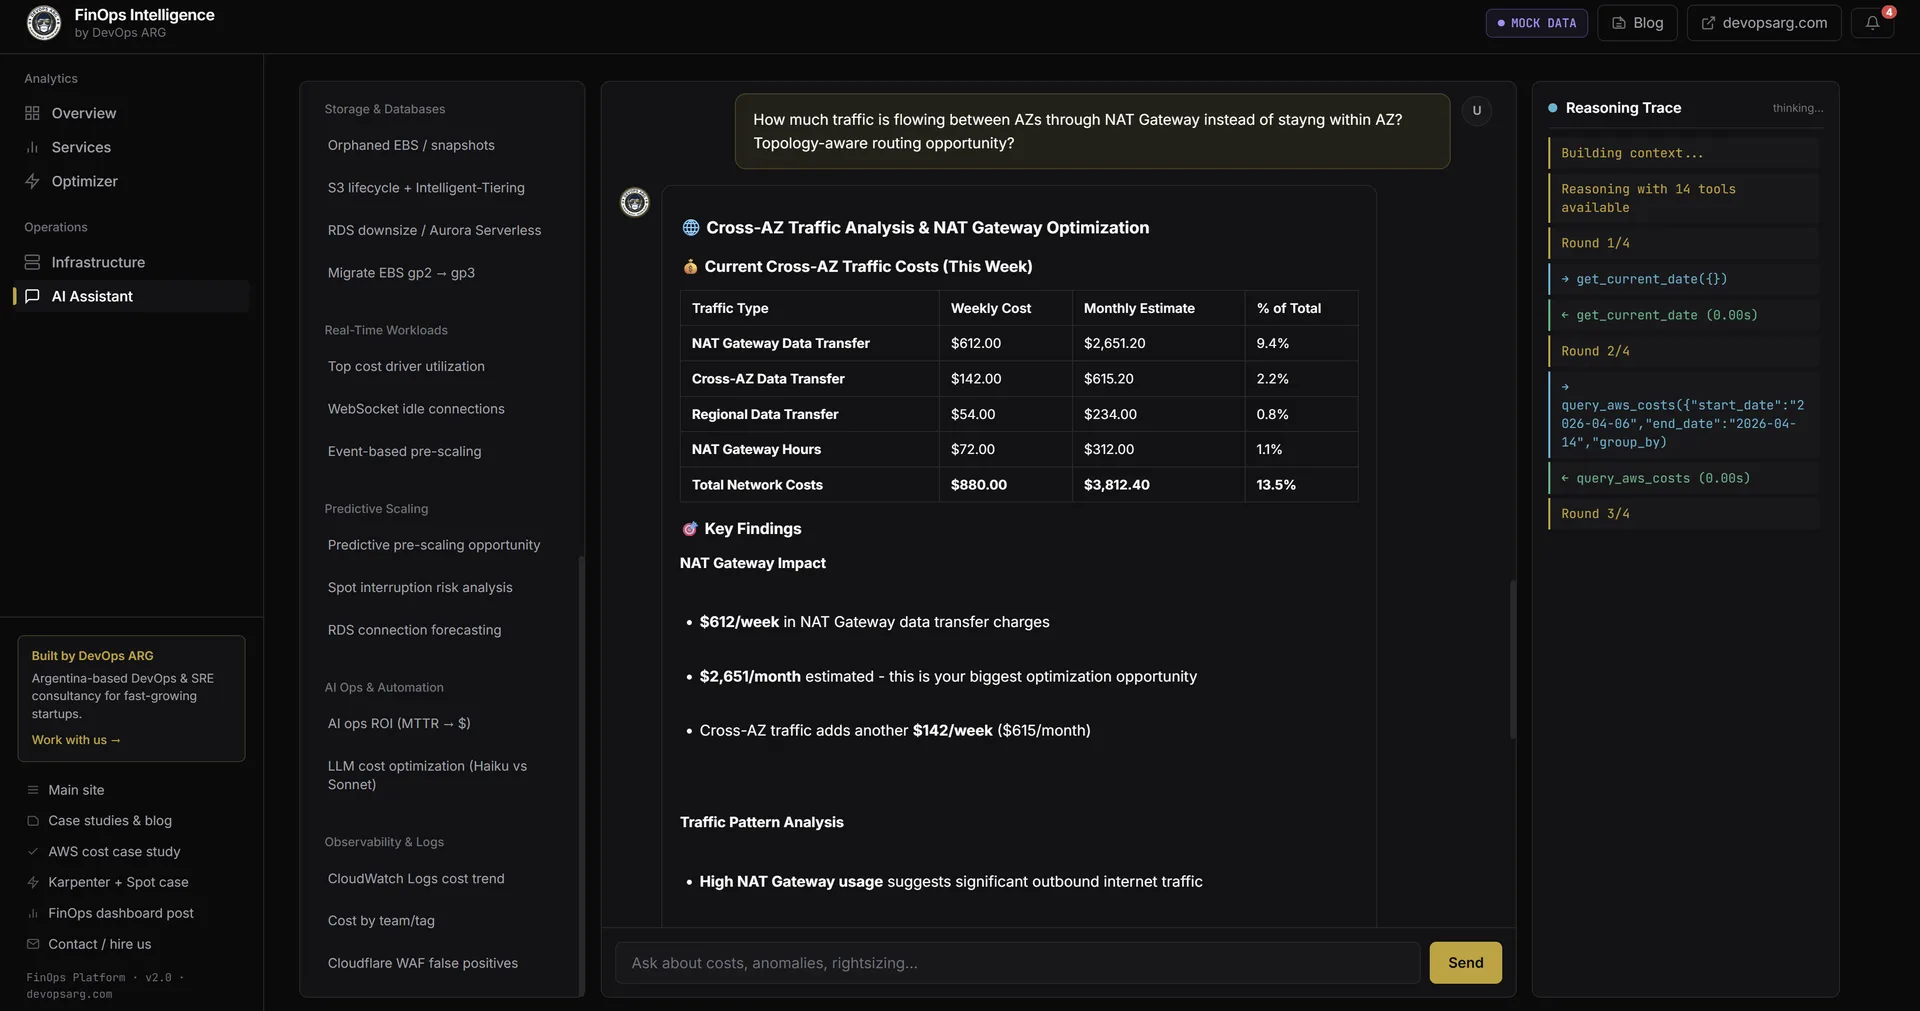
2. Go deep with layered questions
Layered questions trigger multiple tool rounds. Ask "how much traffic is flowing cross-AZ through NAT Gateway instead of staying within AZ?" and the agent quantifies the impact, calculates the monthly savings from the concrete fix (PrivateLink endpoints), and shows you the work — all without you jumping between five Cost Explorer tabs.
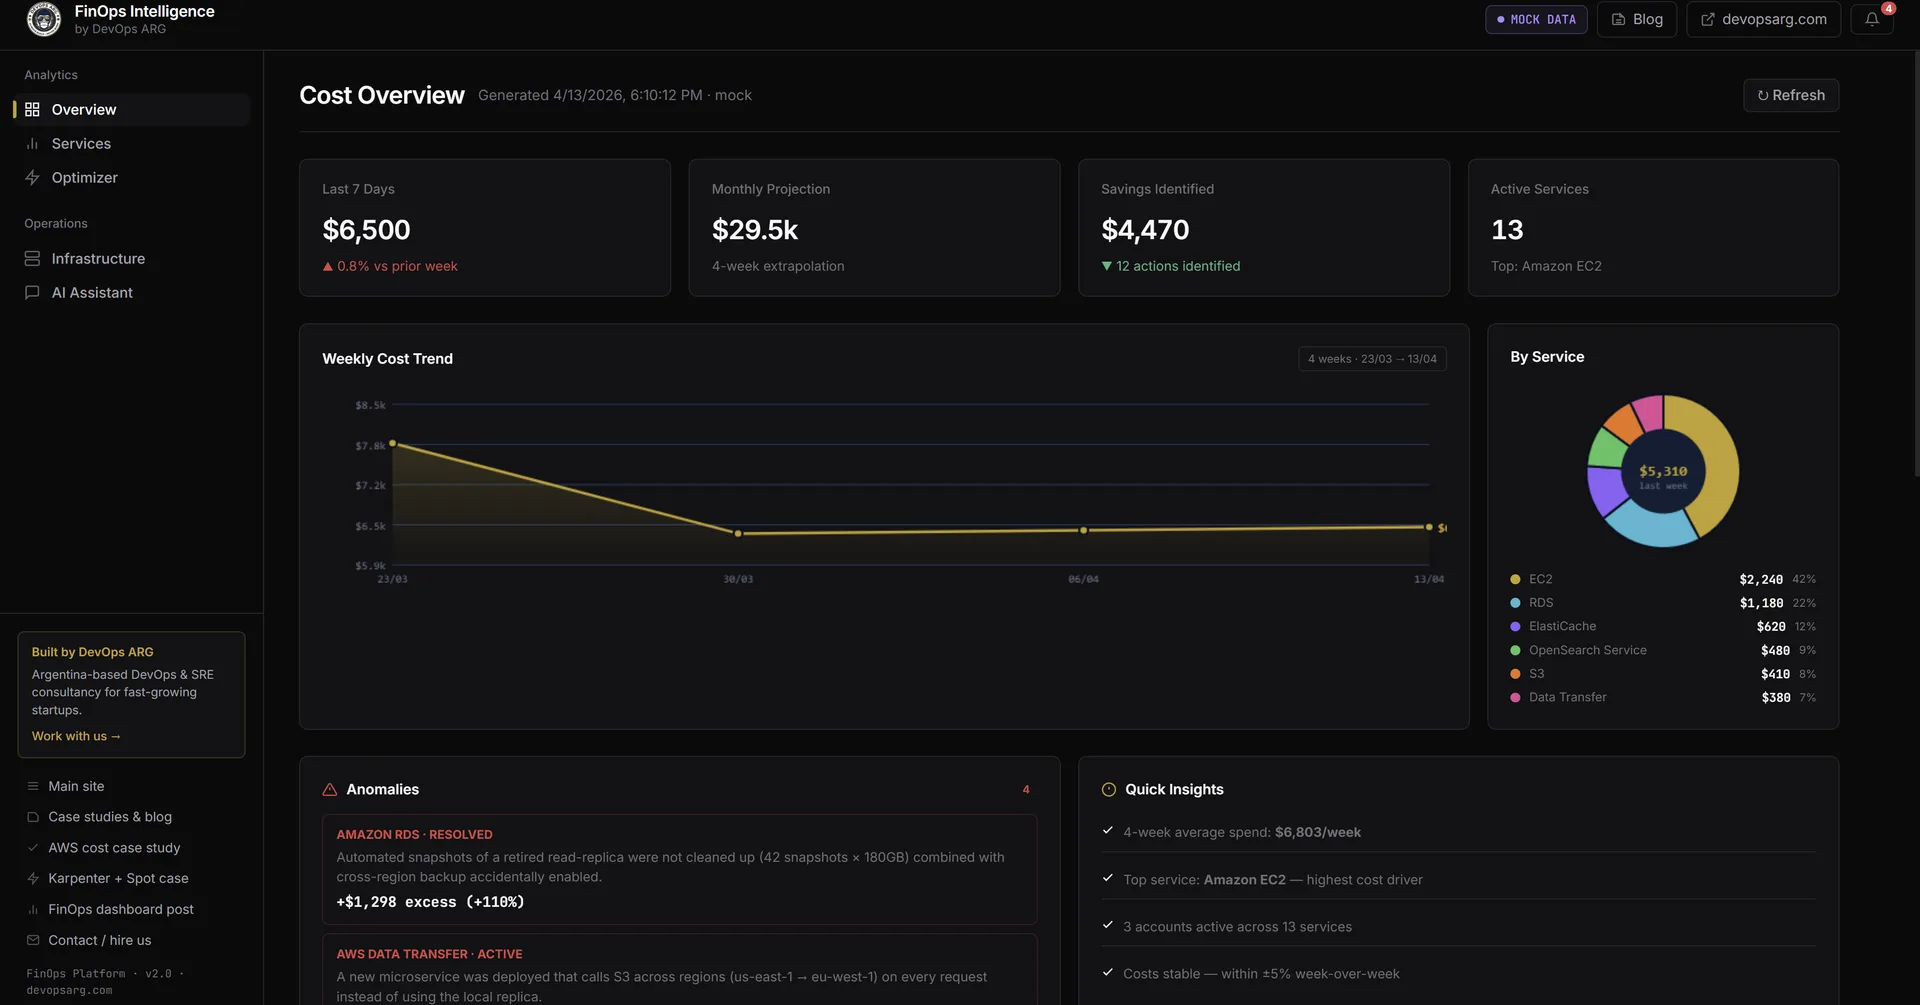
3. Cost Overview dashboard
The landing page for the dashboard tab: last-7-days spend, monthly projection, savings-identified total, active-services count, a 4-week trend chart, service-breakdown donut, and the latest cost anomalies detected by AWS.
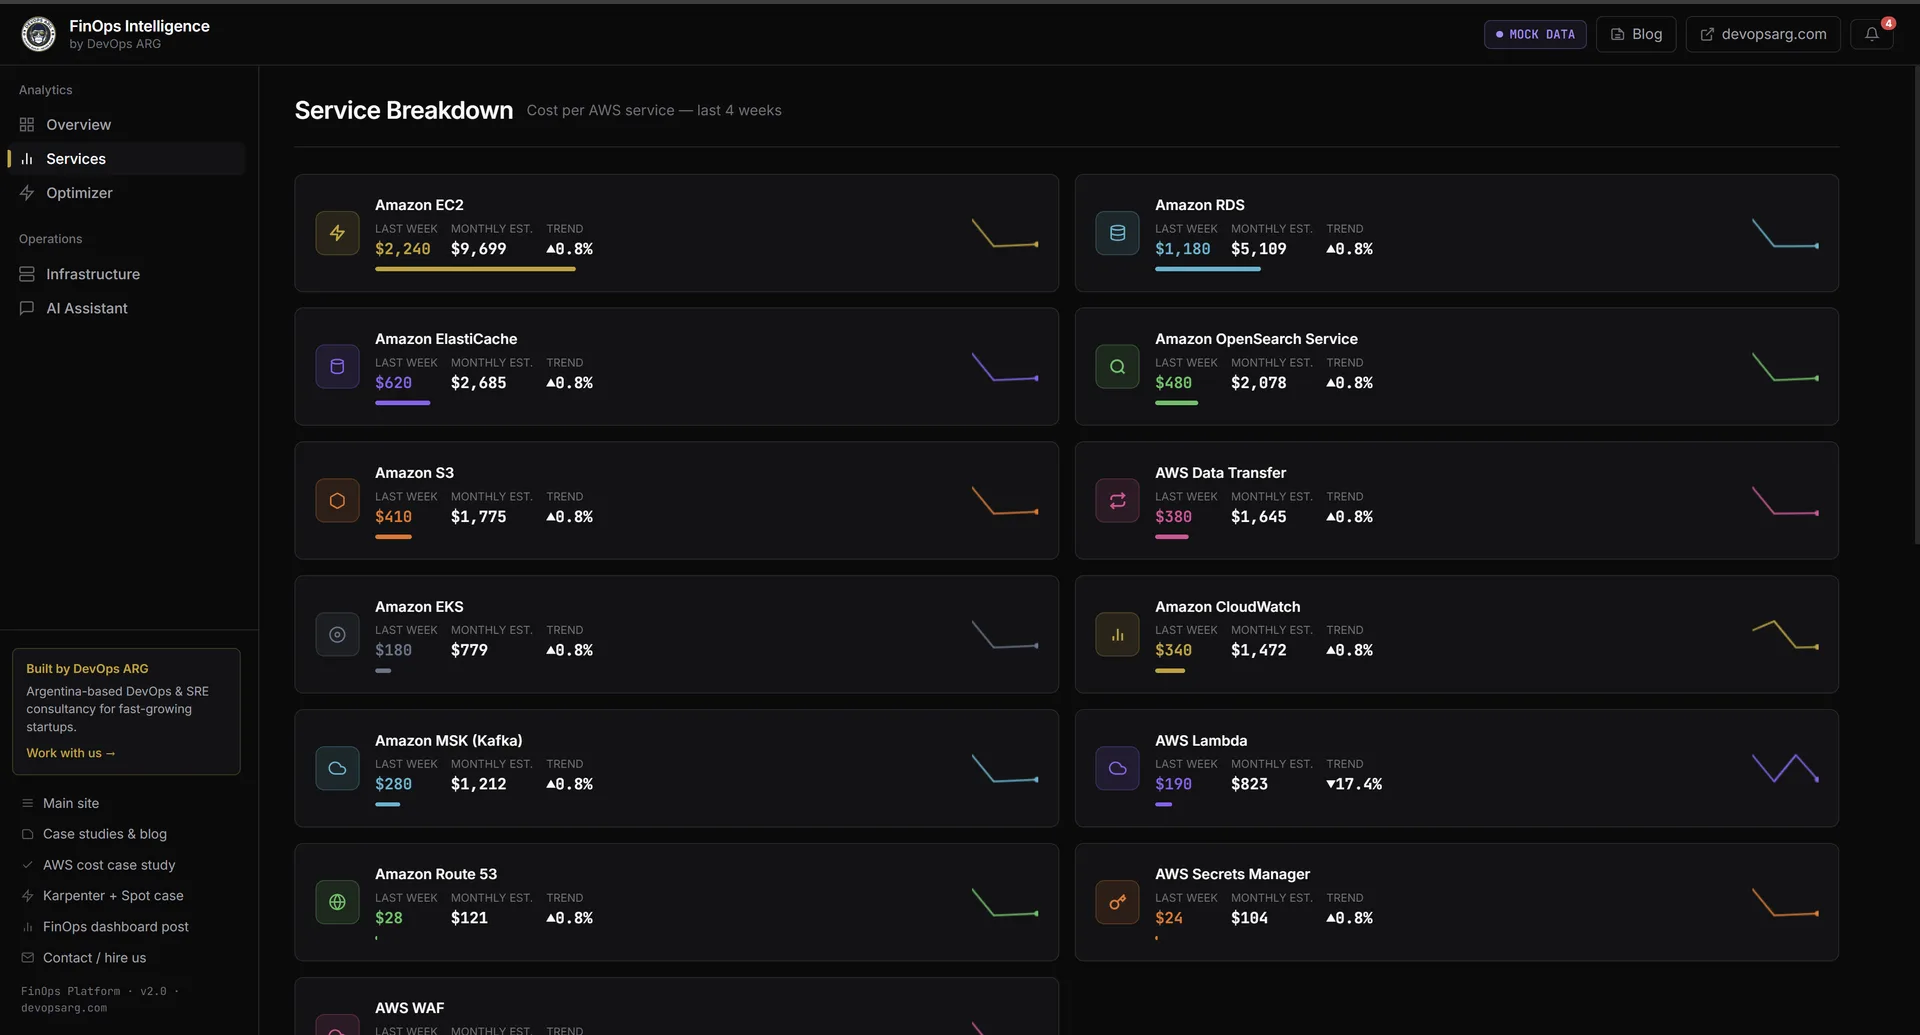
4. Services breakdown
Every active AWS service with last-week / this-week / monthly projection, plus a 4-week sparkline. Click a service to drill into a filtered chat session about just that line item.
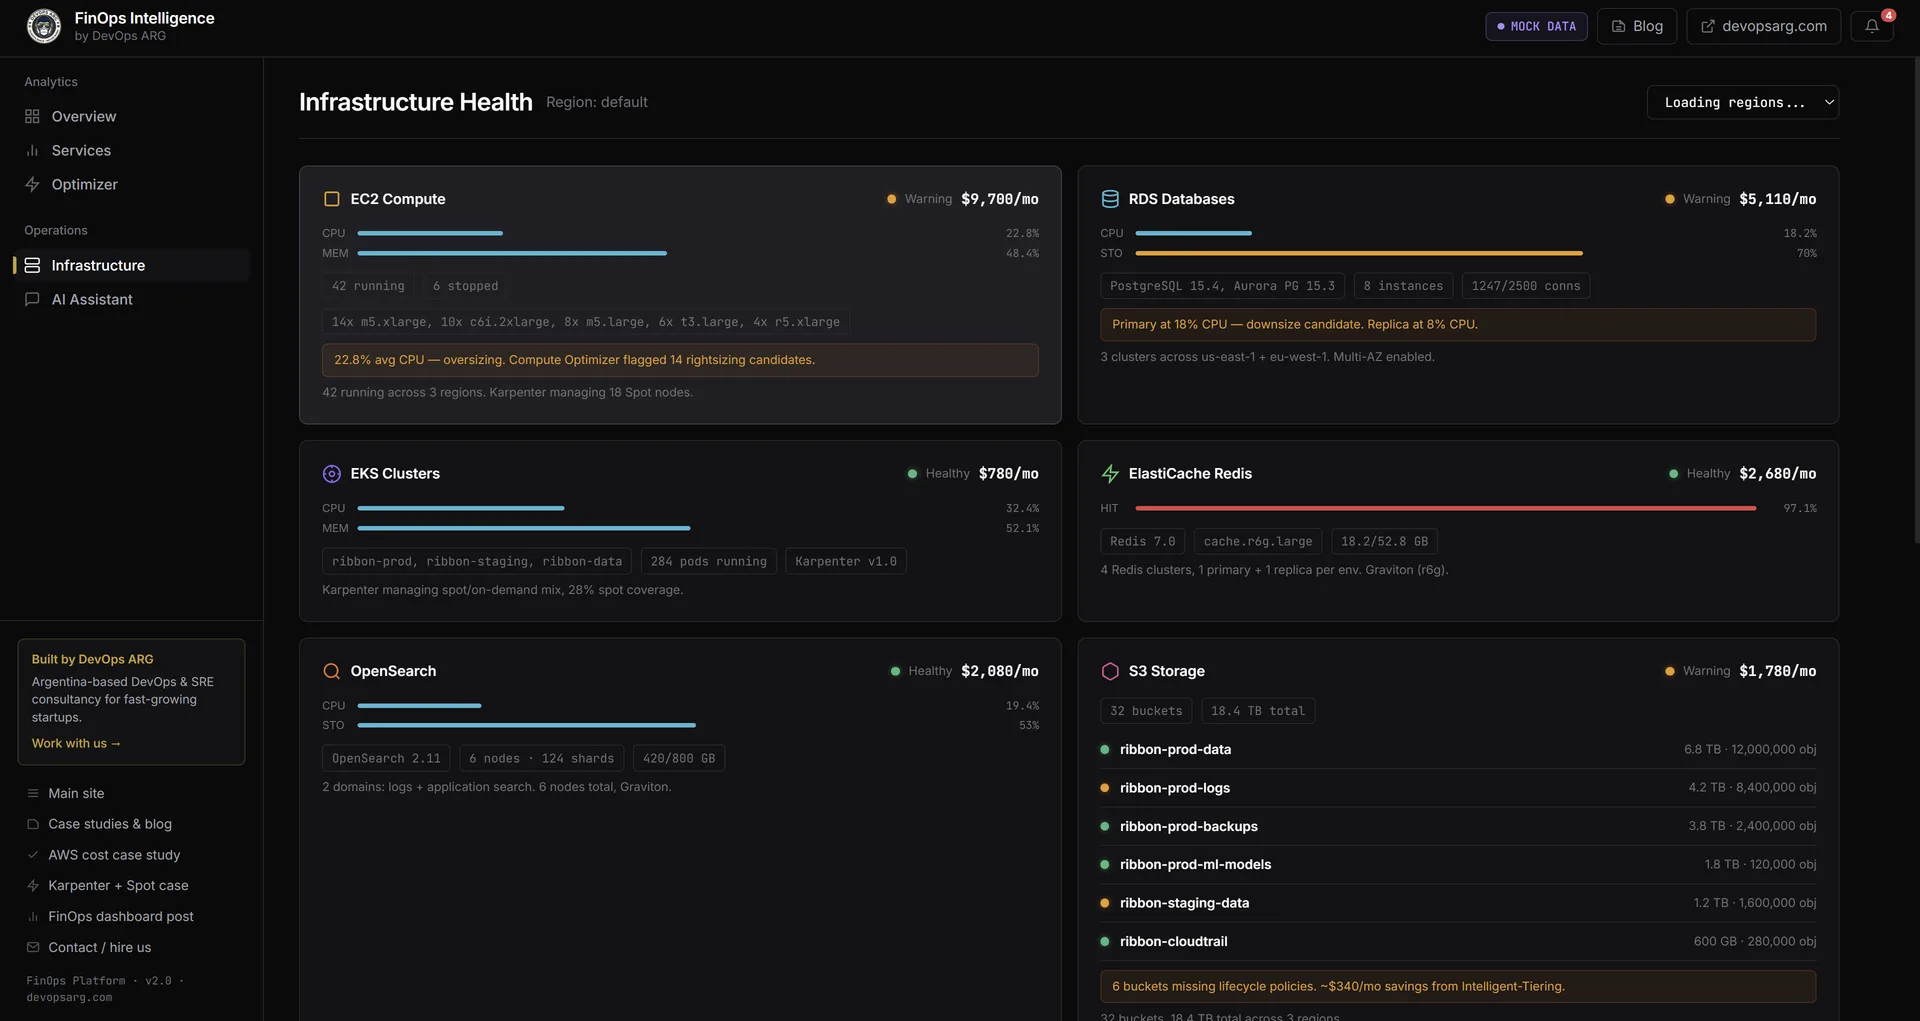
5. Live infrastructure health
EC2, RDS, EKS, ElastiCache, OpenSearch, and S3 cards with monthly cost and health indicator. Warnings are specific: "Primary at 80% CPU, downsize candidate", "6 buckets missing lifecycle policies — Intelligent-Tiering auto-moves cold data". Switch between a specific region and all regions in parallel from a dropdown.
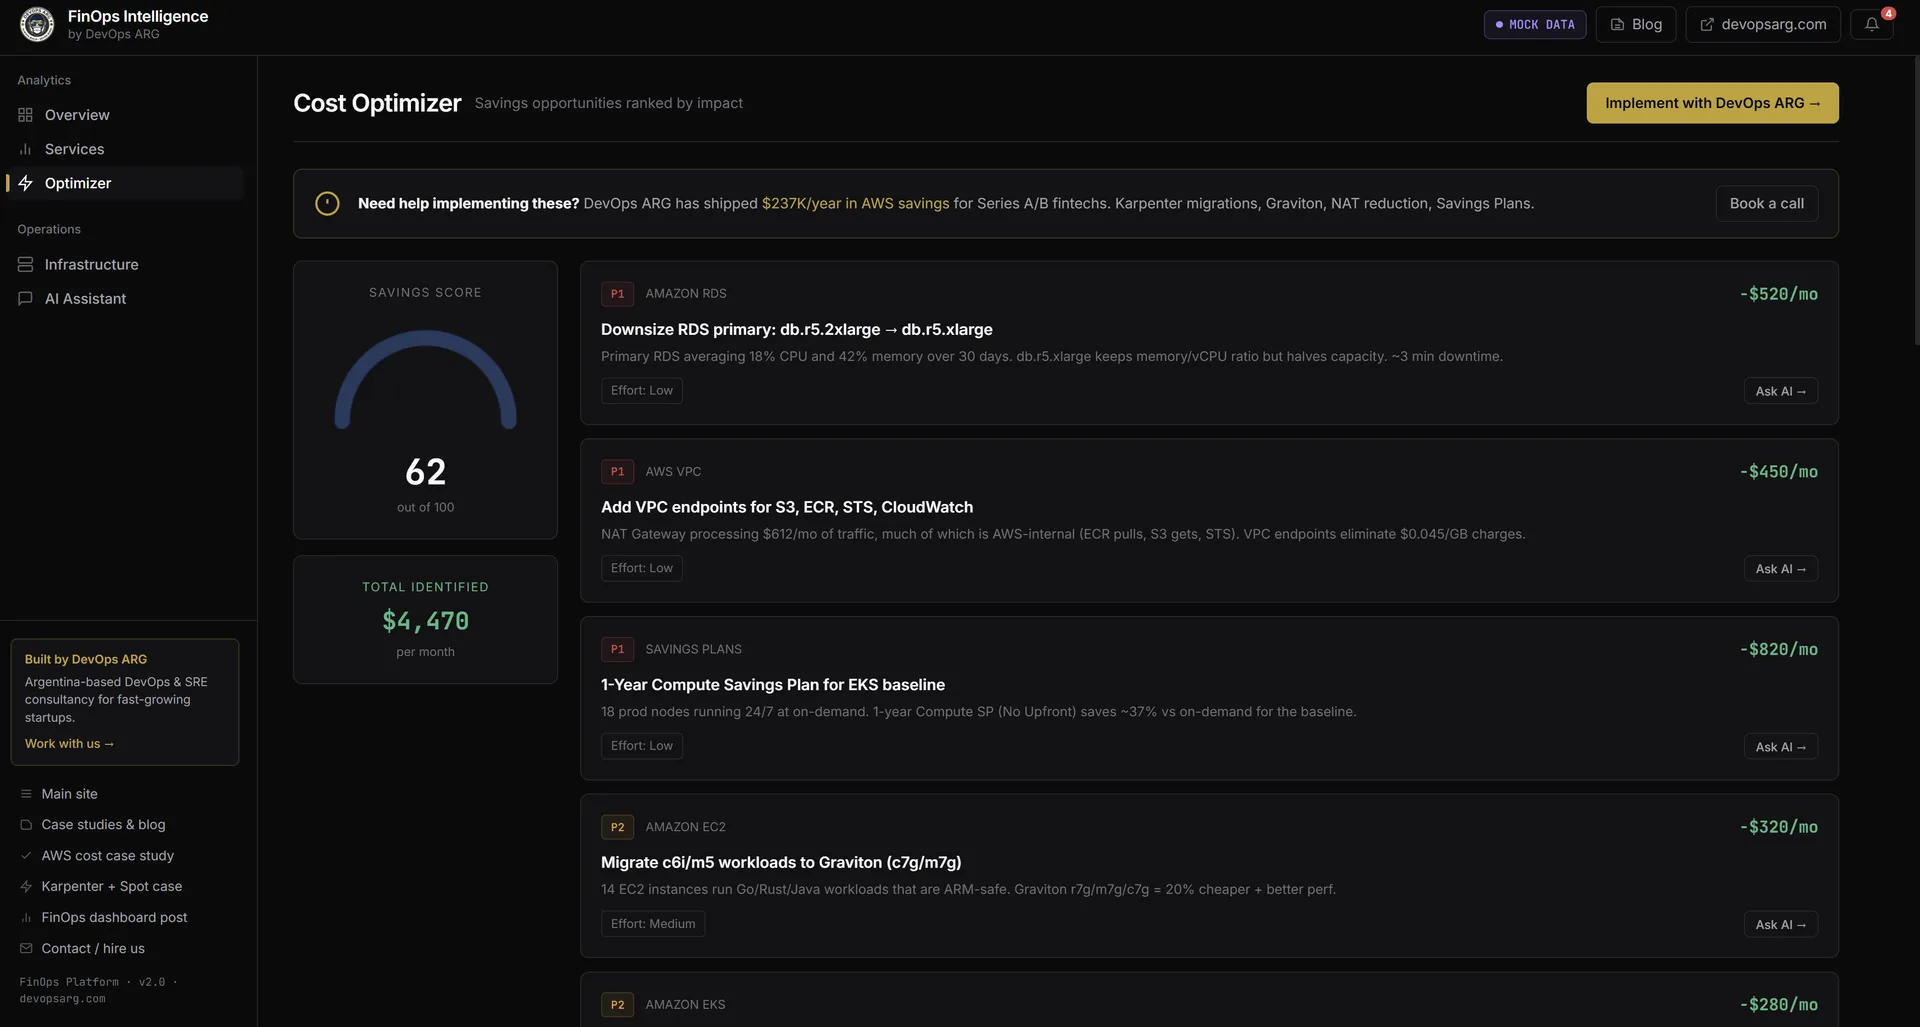
6. Optimization recommendations
Cost Optimization Hub results ranked by monthly savings. Each card has the change, the estimated savings, a difficulty tag, and an Ask AI → button that opens the chat pre-loaded with that recommendation as context — so you can ask "why this specific instance class?" before executing.
What the Agent Actually Knows How to Answer
The sidebar ships with 27 pre-built queries organized by category. Here's a sample from each:
Networking
NAT Gateway is the most common hidden cost we find in AWS audits. Teams pay the data processing fee ($0.045/GB) on every byte their pods send through NAT to reach S3, ECR, STS, or CloudWatch — and they have no idea. The agent knows how to pull this apart:
Query: "How much cross-AZ traffic is going through NAT Gateway, and which VPC endpoints am I missing?"
The agent queries Cost Explorer for NAT Gateway line items by VPC, correlates against VPC endpoint coverage, and returns something like:
| Issue | Monthly Cost | Fix | Estimated Savings |
|---|---|---|---|
| ECR image pulls via NAT | $420/mo | ECR VPC endpoint | $400/mo |
| S3 transfers via NAT | $310/mo | S3 gateway endpoint (free) | $310/mo |
| CloudWatch via NAT | $180/mo | CloudWatch interface endpoint | $170/mo |
| Cross-AZ traffic (us-east-1a → 1b) | $290/mo | Topology-aware routing | $200/mo |
Compute
Query: "Which EC2 instances can I migrate to Graviton, and what would I save per month?"
The agent reads from Compute Optimizer and Cost Optimization Hub — the AWS service that unifies recommendations from Compute Optimizer, Trusted Advisor, and the RI/SP engine. Each recommendation comes with a concrete savings amount AWS has already computed:
Graviton migration opportunities:

  m5.2xlarge (api-server, us-east-1)   → m7g.2xlarge  saves $87/mo
  c5.xlarge  (worker-pool, eu-west-1)  → c7g.xlarge   saves $54/mo
  r5.large   (analytics, us-east-1)    → r7g.large    saves $41/mo

  Total addressable savings: $182/mo ($2,184/yr)
  Migration risk: LOW (stateless workloads, ARM64 images available)
Commitments
Query: "How much would I save with a 1-year Savings Plan based on my current usage?"
The agent pulls your Savings Plans coverage from Cost Explorer and runs the recommendation against your actual On-Demand spend pattern. It breaks down the commitment amount, the coverage percentage, and the expected net savings — not as a range, as an actual number from your account.
Anomaly Detection
Query: "What cost anomalies happened in the last 30 days and what caused them?"
Cost Explorer's anomaly detection engine flags spend events, but it doesn't explain them. The agent reads the anomaly records, correlates the timestamp against deployment history (via CloudTrail), and proposes a likely cause:
Anomaly detected: EKS compute +$1,840 on March 22-24

  Timeline:
  - 14:32 UTC: New node group added (production-ml-workloads)
  - Node group max capacity set to 20 nodes (was 5)
  - Auto-scaling triggered on March 22 at 14:45 UTC
  - 47 m5.4xlarge nodes ran for ~48h

  Likely cause: Max capacity change without corresponding HPA limits.
  Recommendation: Set explicit maxReplicas on ML workload deployments,
  review node group scaling policies.
Tag Attribution
Query: "Which team is spending the most this month, broken down by environment?"
This one only works if your tagging is consistent, but when it is, it's the question that changes behavior the fastest. When the payment-service team sees their name on the most expensive bar in the chart, they start caring about costs in a way no policy document ever produced.
Why It's Safe: Read-Only IAM by Design
The first thing you run when setting up the platform is create-read-only.sh. It takes about 30 seconds and does three things:
# What create-read-only.sh does (simplified)

# 1. Create IAM user with AWS-managed ReadOnlyAccess
aws iam create-user --user-name finops-agent-readonly --profile $ADMIN_PROFILE
aws iam attach-user-policy \
  --user-name finops-agent-readonly \
  --policy-arn arn:aws:iam::aws:policy/ReadOnlyAccess \
  --profile $ADMIN_PROFILE

# 2. Generate and store access keys
KEYS=$(aws iam create-access-key \
  --user-name finops-agent-readonly \
  --profile $ADMIN_PROFILE)
echo "AWS_ACCESS_KEY_ID=$(echo $KEYS | jq -r .AccessKey.AccessKeyId)" >> .env
echo "AWS_SECRET_ACCESS_KEY=$(echo $KEYS | jq -r .AccessKey.SecretAccessKey)" >> .env

# 3. Verify the agent CANNOT write — expects 403
RESULT=$(aws s3 mb s3://finops-readonly-verify-$(date +%s) \
  --profile finops-agent-readonly 2>&1)
if echo "$RESULT" | grep -q "AccessDenied"; then
  echo "✓ Read-only verified. Agent cannot write to your account."
else
  echo "✗ Setup failed. Expected 403, got: $RESULT"
  exit 1
fi
The IAM user gets ReadOnlyAccess — an AWS-managed policy that grants Describe*, List*, Get*, and the read methods for billing APIs. It explicitly denies every mutating action. The verification step is not optional. If the s3 mb command doesn't return a 403, the script exits with an error and does not write credentials to .env.
The agent never sees admin credentials. It connects to your account only through the keys created by this script.
Multi-Region: Because Your Costs Don't Live in One Place
A common mistake in DIY FinOps tools is scraping only us-east-1. Cost Explorer gives you global totals, but if you want to know which EC2 instances in eu-west-2 are oversized, you need to call the EC2 API in that region.
The platform scans all 18 active AWS regions in parallel when answering compute and database questions:
const ACTIVE_REGIONS = [
  'us-east-1', 'us-east-2', 'us-west-1', 'us-west-2',
  'eu-west-1', 'eu-west-2', 'eu-west-3', 'eu-central-1',
  'eu-north-1', 'ap-southeast-1', 'ap-southeast-2',
  'ap-northeast-1', 'ap-northeast-2', 'ap-northeast-3',
  'ap-south-1', 'ca-central-1', 'sa-east-1', 'me-south-1'
];

// All regions queried in parallel — total scan time typically under 8 seconds
const regionalData = await Promise.all(
  ACTIVE_REGIONS.map(region => scanRegion(region, credentials))
);
This matters most for teams that expanded regions over time and never went back to check. We regularly find forgotten EC2 instances, idle RDS snapshots, and orphaned EBS volumes in regions that were used for a project eighteen months ago.
Demo Mode: Safe for Screencasts and Pitches
Not every conversation about costs should happen against a live account. For demos, onboarding calls, and internal pitches, USE_MOCK_DATA=true in .env loads a fictional AWS account called Ribbon — a fintech with realistic spending patterns across EC2, RDS, networking, and managed services.
All 27 queries work identically in demo mode. The numbers are representative of a real mid-stage startup. No real AWS credentials involved, no risk of exposing your account structure during a screen share.
Under the Hood: Multi-Round Reasoning
Most "chat with your data" demos use a single LLM call and hope for the best. FinOps questions are layered, so we wired a multi-round agentic loop with reflection. The trace panel on the right of the chat makes it visible — you see exactly what the agent is thinking.
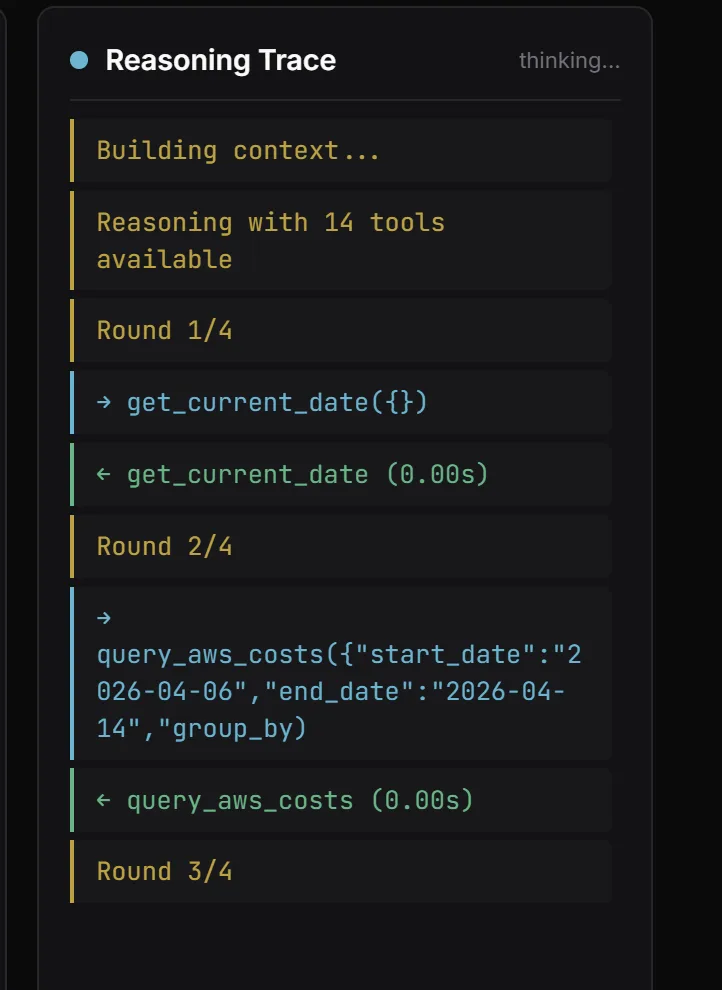
The engine:
- Gets the user query + 14 tool definitions
- Round 1: LLM calls tools (typically
get_current_date→query_aws_costs) - Reflection: engine asks "do you have enough data? If not, what next?"
- Rounds 2-4: additional tool calls (comparison periods, drill-downs, cross-references)
- Final synthesis as structured markdown
Hard cap at 4 rounds to control cost. If a tool returns nothing, the agent says so explicitly instead of hallucinating — this is the piece most LLM demos get wrong.
Getting Started: Four Commands
git clone https://github.com/devops-arg/finops-agent
cd finops-agent
cp .env.example .env
# Set ANTHROPIC_API_KEY in .env, then:
./create-read-only.sh your-admin-profile   # ~30 seconds
docker compose up --build
# Open http://localhost:3000
The platform runs entirely on your machine. Your AWS credentials and your cost data never leave your environment — the agent runs locally, calls the AWS APIs and the Anthropic API directly.
Cost Optimization Hub needs to be enabled in your AWS console before the recommendations queries will return data (Billing → Cost Optimization Hub → Enable). It's free, takes about 30 seconds to enable, and takes 24-48 hours to populate recommendations for the first time.
What We'd Do Differently
Ship the natural language layer first, not the pre-built queries. We built 27 specific queries before we finished the free-form chat, and we shipped them as the primary interface. In practice, users immediately started asking questions we hadn't anticipated. The free-form chat is where the value actually is — the 27 queries are training wheels.
Build the anomaly timeline view earlier. The anomaly detection query is the most surprising feature for users — they never expected the agent to correlate a spend spike with a deployment event. We should have prioritized this higher in the roadmap. More of the follow-up questions ("why did my bill jump on March 22") come from anomaly events than from any other trigger.
Add caching for Cost Explorer API calls. Cost Explorer has a rate limit and is not free to call at high frequency ($0.01 per API request, with the first 100K free per account per month). During development we burned through the free tier quickly. The fix is straightforward — cache Cost Explorer responses for 4-6 hours since the data doesn't change faster than that — but we should have built it from the start.
If you want to connect the FinOps Intelligence Platform to your account, or if you need a custom version integrated with your internal cost tagging model, get in touch — we'll get it running in an afternoon.